Predict time series sampling from historical data
This is part of a series of methods to predict stock performance by using different statistic approaches
Question:
How can I predict the performance of a stock or time series process using the distribution of the data?
Solution:
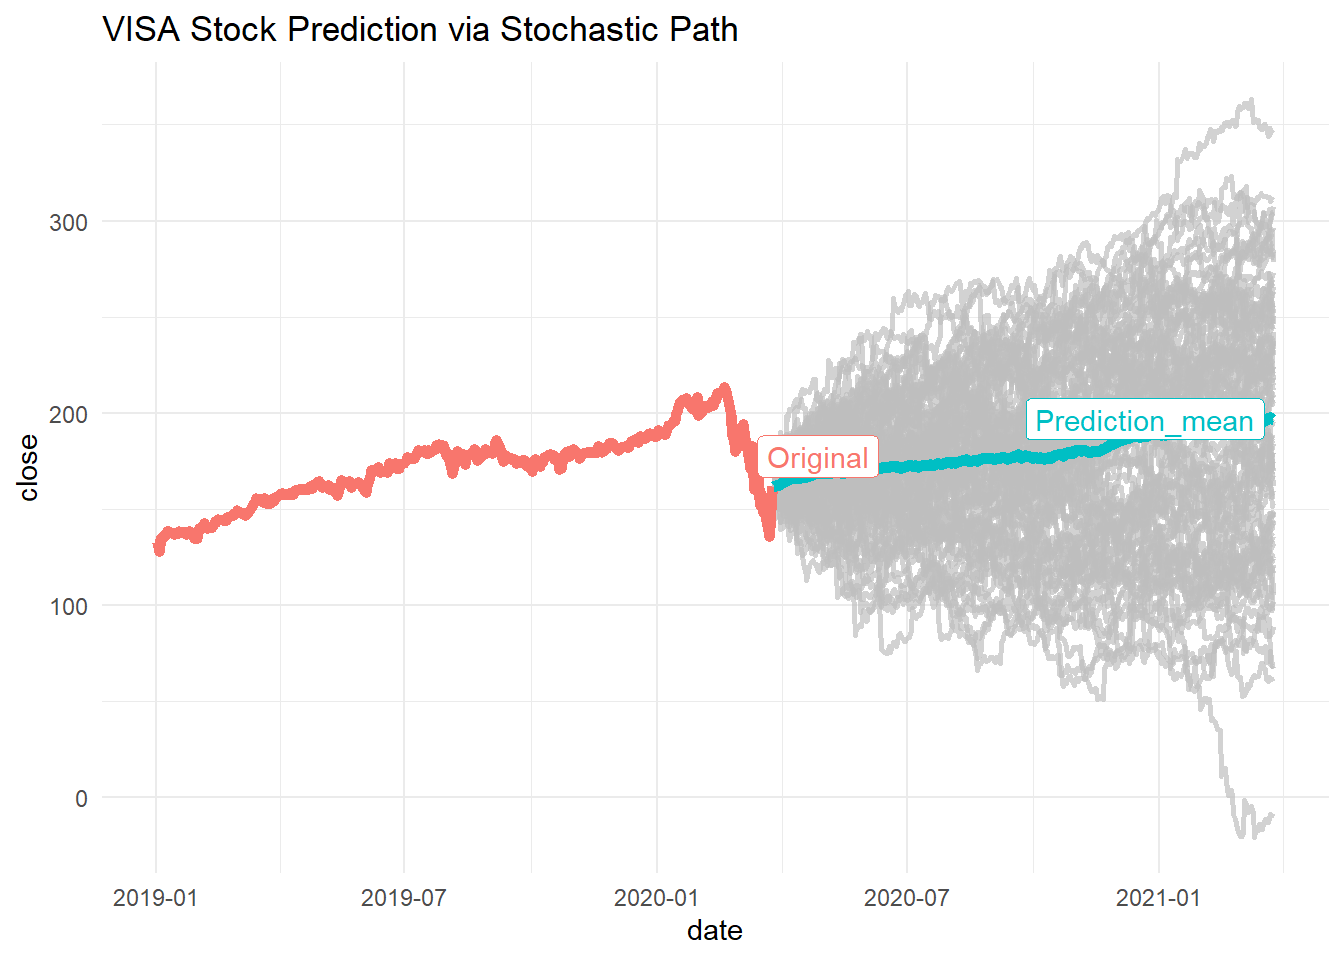
For this we will use a stock at random like VISA with ticker Vin the NYSE. To use this predictive method we calculate the density (probability) of the different daily returns and we calculate several paths that the stock could follow. At the end we estimate the average path as our predicction.
require(tidyquant)
require(tidyverse)
library(gghighlight)

# Download dataset
tidyquant::tq_get("V") %>% dplyr::filter(date >= as.Date("2019-01-01")) -> VISA

# We calculate the daily returns (change of price of one day vs the day prior)
VISA %>%
  dplyr::select(date, close) %>%
  dplyr::mutate(delta = close - lag(close)) -> VISA_df

# Now we estimate the density of the daily returns (probability to get a return in a given day)
VISA_df %>%
  dplyr::filter(complete.cases(delta))  %>%  # remove missing values (just 1)
  pull(delta) %>%
  density() -> dens

VISA_df$close %>% tail(1) -> lastPrice # lastPrice
VISA_df$date %>% tail(1) -> lastDate # lastPrice

# We sample from this probability what will be the next delta
sampler <- function(dens,n = 1){
  sample <- sample(dens$x,n,replace = TRUE, prob = dens$y)
  return(sample)
}

# Add delta to the last price to calculate next day price
predPrice <- function(sample,price){
  newprice <- price + sample
  return(newprice)
}

# Now we calculate a prediction for N steps
predPath <- function(N = N,dens = dens,lastPrice = lastPrice){
  vec <- rep(NA,N)
  base <- lastPrice
  # loop to do N steps
  for(i in 1:N){
    vec[i] <- sampler(dens) %>% predPrice(base)
    base <- vec[i]
  }
  return(vec) # Return the predicted path
}

# Finally we can run this several times to have many predictions
loopPaths <- function(J = J, N = N, dens = dens, lastPrice = lastPrice){
  simulations <- list()
  for(j in 1:J){
    simulations[[j]] <- predPath(N = N, dens = dens, lastPrice = lastPrice)
  }
  simulations %>% plyr::ldply() -> paths
    return(paths)
}

# We run 100 simulations, for 365 predictions within each
loopPaths(J = 100, N = 365, dens = dens, lastPrice = lastPrice) %>% t() -> Predictions

# Save the predictions in a data set
data.frame(date = seq(lastDate+1,length.out = 365,by = "day"),Predictions) %>%
  gather(key = "simulation",value = "close",-date) -> Pred_set

# Predict mean path
Predictions %>% apply(MARGIN = 1,mean) -> Prediction_mean
data.frame(date = seq(lastDate+1,length.out = 365,by = "day"),Prediction_mean) %>%
  gather(key = "simulation",value = "close",-date) -> Pred_mean_set

# Combine all the data sets
VISA_df %>% dplyr::mutate(simulation = "Original") %>%
  dplyr::select(date,simulation, close) %>%
  bind_rows(Pred_mean_set) %>%
  bind_rows(Pred_set) -> VISA_set


# Visualize the predictions
VISA_set %>%
ggplot(aes(x = date, y = close, colour = simulation)) + geom_line(size = 2) +
  gghighlight(grepl("Original|Prediction_mean",simulation),  label_key = simulation,
              unhighlighted_params = list(size = 1)) +
  ggtitle("VISA Stock Prediction via Stochastic Path") +
  theme(legend.position = "none") +
  theme_minimal()
